Industry Benchmarks
The Benchmarks feature automatically shows you how your organization’s AI maturity compares to industry peers, regional standards, and companies in your vertical. Understand where you excel and where improvements are needed.
What Are Benchmarks?
Benchmarks are automatically compiled from anonymized, aggregated assessment scores from thousands of organizations using TruthVouch. They provide context for your own assessment results — revealing whether a score of 65 in “AI Governance” is above average, below average, or typical for your industry.
Comparison Dimensions
Benchmarks are available across:
- Industry vertical (Finance, Healthcare, Retail, Technology, etc.)
- Company size (1-10, 11-50, 51-250, 251-1000, 1000+ employees)
- Geography (US, Europe, APAC, etc.)
- Maturity stage (Early, Growth, Mature)
Example: “Your governance score is 72, which is in the 68th percentile for mid-market fintech companies.”
Accessing Benchmarks
In Assessment Results
After completing an assessment, scroll to Comparison to Benchmarks:
- Select your comparison group (industry, size, region)
- View your percentile ranking (0-100)
- See dimension-by-dimension breakdown
- Download benchmark report (PDF)
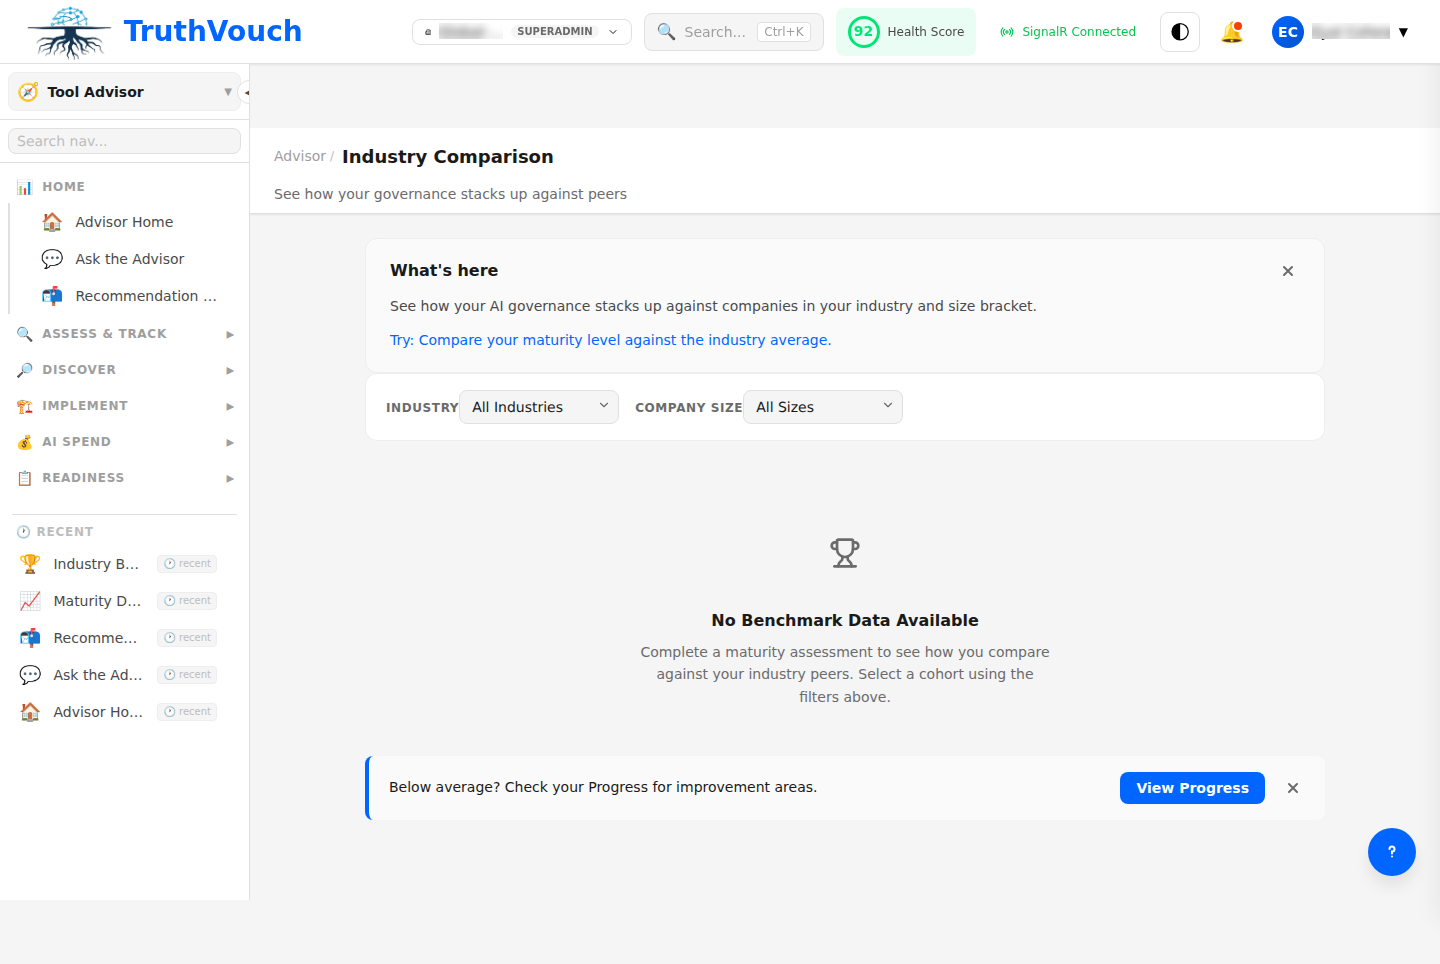
Benchmark Dashboard
In the Advisor home, click Benchmarks. TruthVouch automatically displays:
- Published benchmarks by industry (updated quarterly)
- Historical trends (year-over-year improvements, automatically calculated)
- Compare multiple companies (custom workspaces only)
- Filter by size, region, maturity stage (fast, auto-aggregated views)
Understanding Percentiles
Percentile ranking shows what % of peer organizations scored equal to or below you:
- 90th percentile or higher = Top performer for your group
- 70-89th percentile = Above average
- 40-69th percentile = Average
- 20-39th percentile = Below average
- Below 20th = Lagging indicator; prioritize improvements
Example: “Your Technical Readiness score puts you in the 82nd percentile — better than 82% of similar-sized companies in your region.”
Benchmark Categories
1. AI Governance & Strategy
- AI governance framework maturity
- Risk management processes
- Board/executive oversight level
- Policy documentation completeness
2. Technical Implementation
- LLM monitoring and observability
- Hallucination detection capability
- Data quality and validation
- System architecture maturity
3. Compliance & Ethics
- Regulatory compliance readiness
- Bias detection and mitigation
- Transparency and explainability practices
- Data privacy controls
4. Operations & Culture
- Team skills and training
- Incident response procedures
- Cross-functional alignment
- Change management maturity
Trends & Historical Data
View how benchmarks have evolved:
Year-Over-Year (YoY) Changes
- “Governance scores increased 8 points across mid-market in 2024”
- “Small companies now match large enterprises in compliance readiness”
- “90% of financial services firms now have hallucination detection”
Emerging Patterns
- Fastest-growing areas (e.g., “Regulatory readiness up 15% YoY”)
- Lagging areas (e.g., “Bias mitigation lowest-scored across all verticals”)
- Convergence trends (benchmarks narrowing = industry standardizing)
Seasonality
- Benchmarks update quarterly
- Spikes after major regulatory changes (e.g., EU AI Act implementation)
- Lag 30 days behind data collection (data processing and anonymization)
Custom Benchmarking (Enterprise)
Enterprise customers can:
Create Private Peer Groups
- Define your own comparison cohort (e.g., “Competitors in our market segment”)
- Invite external partners for blind benchmark participation
- Set custom dimensions (e.g., “Fortune 1000 financial firms using GPT-4”)
Export Data for Analysis
- Raw percentile data (CSV)
- Trend tables (12-month history)
- Peer comparison matrices
Set Custom Targets
- Define goal percentiles for each dimension
- Track progress against custom benchmarks quarterly
- Alert when you fall below target
Using Benchmarks for Strategy
1. Identify Strengths
- Where are you outperforming peers?
- Invest to maintain competitive advantage
- Share learnings across your organization
2. Prioritize Gaps
- Find high-impact improvements (biggest gap + highest peer score)
- Focus on areas where peers are rapidly improving
- Avoid “nice-to-have” improvements in areas where you already lead
3. Set Goals
- Aspire to 75th percentile in critical areas (governance, compliance)
- Maintain 60th percentile or higher in operational areas
- Use 12-month benchmark updates to track progress
Example: “We’re at 45th percentile in Technical Readiness. Target: 70th percentile by EOY (industry average is 62nd). Investment needed: hallucination detection + observability.”
Privacy & Anonymization
- No company names in published benchmarks
- Aggregated data only — minimum 50 companies per segment
- Individual results confidential — your scores are never shared
- Opt-out available — disable benchmark participation in Settings
Benchmark Methodology
Benchmarks use:
- Weighted scoring — each assessment dimension scored consistently
- Quartile binning — results grouped into tiers for stability
- Temporal smoothing — outliers filtered to show stable trends
- Segment stability — benchmarks only published for segments with 50+ participants
Related Topics
- Assessment Scoring — How individual dimensions are calculated
- Taking an Assessment — Step-by-step assessment walkthrough
- Improvement Planning — Actions based on benchmark insights
Next Steps
- Complete your assessment if you haven’t already
- Review your percentiles — identify top 3 improvement areas
- Set benchmark goals — target 75th percentile in critical areas
- Re-assess quarterly — track your progress against peers