AI Spend Dashboard
The AI Spend Dashboard automatically centralizes all AI-related costs across your organization. TruthVouch tracks spending by vendor, model, department, and project, identifies optimization opportunities, and alerts you to budget overages.
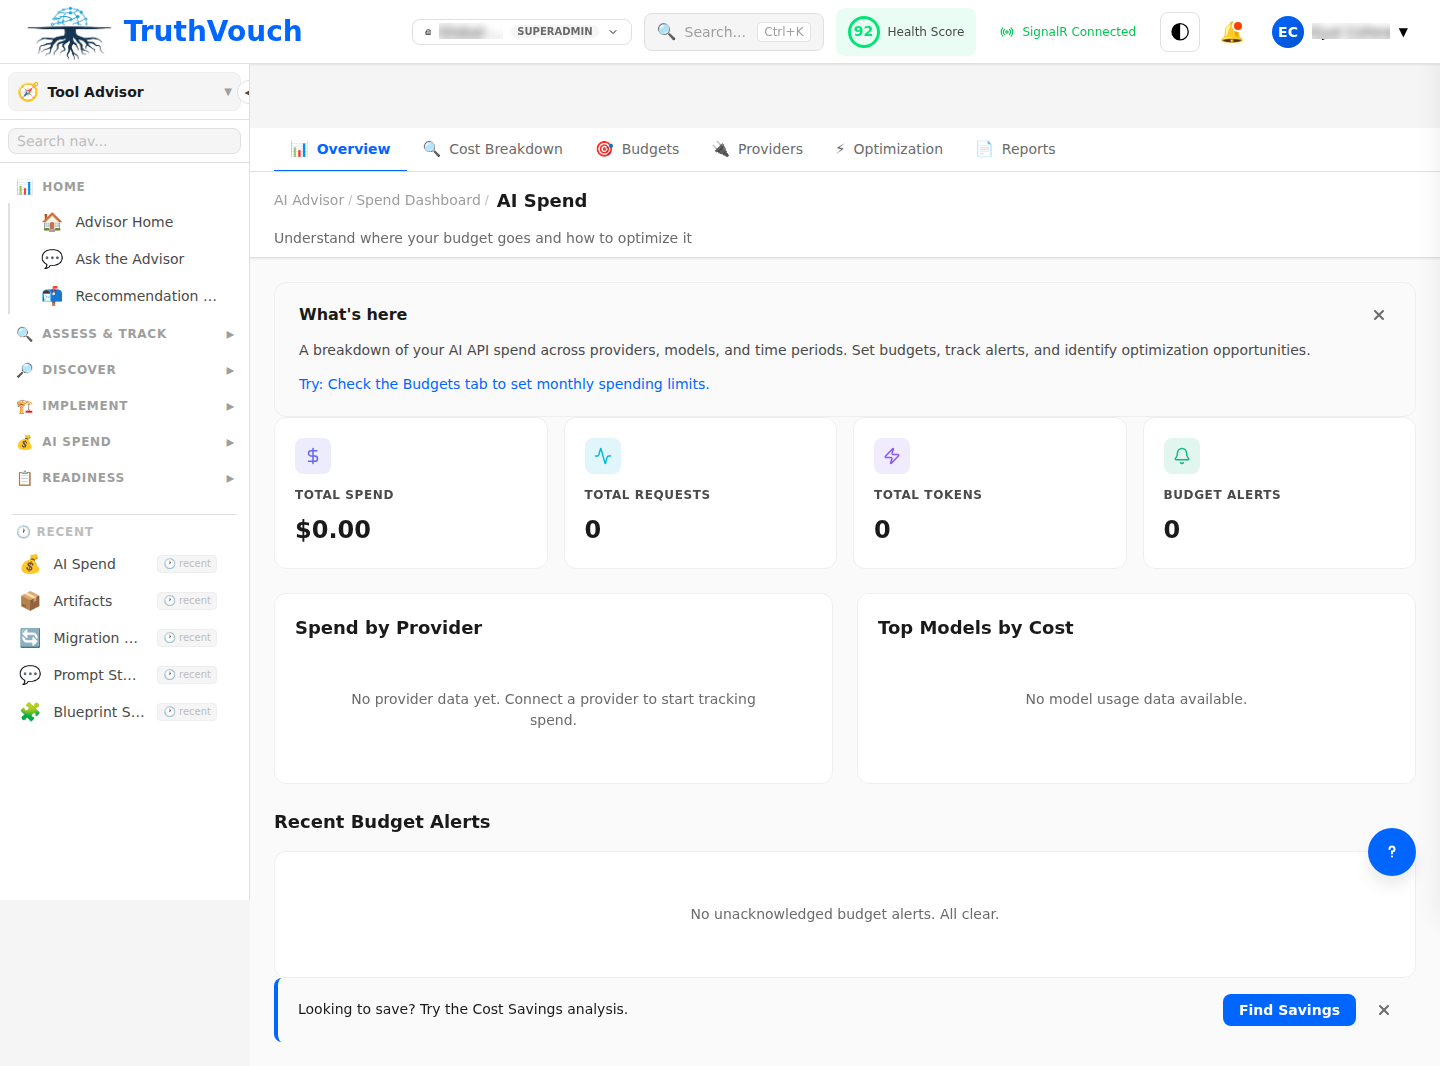
Dashboard Overview
Key Metrics
Current Month Spend (top of page)
- Total: $XX,XXX
- vs. Last month: +5% / -8%
- vs. Budget: On track / Over / Under
- Forecast (end of month): $XX,XXX
Cost Breakdown by Dimension
| Category | Amount | % of Total | Trend |
|---|---|---|---|
| By Vendor | |||
| OpenAI | $15,200 | 45% | ↑ 8% |
| Anthropic | $8,500 | 25% | ↑ 3% |
| Google Cloud | $5,300 | 16% | ↓ 2% |
| Azure (Microsoft) | $3,800 | 11% | ↓ 5% |
| By Model | |||
| GPT-4 | $9,500 | 28% | ↑ 12% |
| GPT-3.5 | $4,200 | 12% | ↓ 6% |
| Claude Opus | $6,800 | 20% | ↑ 5% |
| Gemini Pro | $3,100 | 9% | → |
| Other | $4,200 | 31% | ↑ 2% |
Spending Trends
View 7-day, 30-day, or 90-day trends:
- Line chart showing daily spend
- Spikes annotated with cause (new deployment, volume surge, model change)
- Forecast line (projected spending if trend continues)
- Budget threshold line (your monthly limit)
Budget Health
Status indicator (red/yellow/green):
- Green: On track (80-100% of monthly budget)
- Yellow: Caution (100-110% of budget)
- Red: Over budget (>110%)
Alerts:
- If current pace exceeds monthly budget, alert: “On pace to exceed budget by $X by month-end”
- Recommend actions (reduce usage, switch models, optimize prompts)
Cost Breakdown Views
By Vendor
See spending across all LLM providers you use:
OpenAI: $15,200├─ API Calls: $14,500├─ Fine-tuning: $500└─ Token overage charges: $200
Anthropic: $8,500├─ API Calls: $8,500└─ SLA credits: -$100
Google Cloud: $5,300├─ Vertex AI (managed): $3,200├─ Gemini API: $1,800└─ Infrastructure: $300
Click any vendor to drill into:
- Daily cost trend
- Models used and their share of cost
- Top projects/apps consuming this vendor
- Cost per 1M tokens (efficiency metric)
By Model
Compare cost efficiency across models:
| Model | Monthly Cost | Monthly Tokens | Cost/1M Tokens | Cost Trend |
|---|---|---|---|---|
| GPT-4 | $9,500 | 630M | $15.08 | ↑ 12% |
| Claude Opus | $6,800 | 320M | $21.25 | ↑ 5% |
| GPT-3.5 | $4,200 | 1,050M | $4.00 | ↓ 6% |
| Gemini Pro | $3,100 | 775M | $4.00 | → |
Insights:
- GPT-4 is most expensive but widely used (ROI high?)
- Gemini Pro and GPT-3.5 are most cost-efficient
- Claude Opus growing usage (good performance but costly)
By Department/Project
See which teams are spending on AI:
Engineering:     $12,400 (37%)  — Code generation, QA automation├─ CodeGen project: $8,200├─ Test automation: $3,100└─ Documentation: $1,100
Product:          $9,800 (29%)  — Customer analytics, recommendations├─ Personalization: $6,500└─ Insights engine: $3,300
Marketing:        $6,200 (18%)  — Content generation, copywriting├─ Campaign automation: $4,200└─ Creative generation: $2,000
Other:            $5,400 (16%)  — Misc experiments, proof-of-concepts
Click any department to see:
- Which projects are using which vendors
- Opportunity for consolidation (multiple teams using different vendors for same task)
- Cost per project and ROI (if available)
Cost Optimization Insights
1. Model Efficiency Opportunities
Recommendation: “You’re using GPT-4 for tasks GPT-3.5 could handle.”
Analysis shows:
- 15% of GPT-4 usage is for simple Q&A (could use GPT-3.5 = 70% cost savings)
- Estimated savings: $1,400/month
Action: Switch 15% of traffic to GPT-3.5. Measure quality impact.
2. Vendor Consolidation
Recommendation: “Consolidate from 4 vendors to 2.”
You’re using:
-
OpenAI (45% of spend)
-
Anthropic (25%)
-
Google (16%)
-
Azure (11%)
-
Small vendor spend (<5% each) creates operational overhead
-
Consolidate to OpenAI + Anthropic. Negotiate volume discounts (5-15% savings typical)
-
Estimated savings: $2,500-$5,000/month
3. Token Usage Optimization
Recommendation: “Reduce prompt size to lower token costs.”
Your average prompt: 850 tokens
- Industry average: 600 tokens
- Opportunity: Optimize prompts, reduce unnecessary context
Estimated savings: 15% = $5,200/month
How to optimize:
- Summarize documents before feeding to AI
- Use few-shot examples instead of verbose instructions
- Truncate large chunks of irrelevant data
4. Batch Processing vs. Real-Time
Recommendation: “Batch 80% of workload to save 20-30%.”
You’re using:
- Real-time API calls (full price): 80%
- Batch processing (discounted rate): 20%
OpenAI Batch API offers 50% discount if you can wait 24 hours.
Opportunity:
- Move analytics, reporting, and non-urgent processing to batch
- Keep real-time for customer-facing features only
- Estimated savings: 10-15% = $3,500-$5,200/month
5. Fine-Tuning vs. Prompting
Recommendation: “Fine-tuning could reduce cost for your domain-specific tasks.”
You’re using large models for specialized tasks (your domain).
- Fine-tuning smaller model might match performance
- Smaller models cost 20-40% less
ROI calculation:
- Fine-tuning cost: $5,000 (one-time)
- Monthly savings: $2,000
- Payback period: 2.5 months
- 12-month ROI: $19,000
Setting Budgets
Create Budget Alerts
- Go to Settings → Budgets
- Set monthly budget: $XX,XXX
- Choose alert thresholds:
- 70% of budget: Yellow warning
- 100% of budget: Red alert
- 120% of budget: Critical alert (auto-throttle?)
Budget by Department
Allocate budgets per team:
- Engineering: $12,000/month
- Product: $10,000/month
- Marketing: $8,000/month
- Research: $5,000/month
System tracks each department’s spend and alerts when approaching limits.
Actions on Budget Overages
When a department approaches its budget:
- Alert — Notify department owner
- Review — Show top cost drivers (projects, models)
- Options:
- Request additional budget
- Reduce usage (switch to cheaper model)
- Optimize efficiency (reduce tokens, batch processing)
- Defer low-priority work
Cost Comparison & Benchmarking
Compare to Industry
(Enterprise only)
See how your spend compares to peer organizations:
- Average spend by company size: $25K-$50K/month (mid-market)
- Your spend: $34K/month
- Percentile: 55th (you’re slightly above average)
- Top cost driver: Industry average is embeddings (40%); yours is chat (45%)
Cost Efficiency Metrics
Cost per unit of work:
- Cost per support ticket handled: $0.35 (GPT-3.5 + overhead)
- Cost per line of code generated: $0.02 (CodeGen project)
- Cost per personalization event: $0.001 (Recommendations)
Use these metrics to:
- Compare projects’ ROI
- Decide if AI is worth it for a use case
- Benchmark efficiency improvements over time
Exporting & Reporting
Monthly Report
Click Export to generate:
- Summary (total spend, major cost drivers, trend)
- Detailed breakdown (by vendor, model, department)
- Optimization recommendations
- Budget vs. actual comparison
Formats: PDF (shareable), CSV (for analysis)
Cost Reconciliation
Sync with billing providers:
- Automatic sync — TruthVouch connects to OpenAI, Anthropic, Google, Azure APIs to pull actual charges
- Reconciliation — Compare TruthVouch usage logs to actual invoices
- Discrepancy alerts — Notify if billed charges don’t match expected usage
Why reconcile?
- Spot billing errors from vendors
- Catch unauthorized usage
- Verify discounts are applied correctly
Related Topics
- Blueprints — Cost estimates per use case
- Migration Planning — Cost impact of switching vendors
- Vendor Evaluation — Compare costs across vendors
Next Steps
- Review current spending — Which vendors and models are you using?
- Identify top 3 opportunities — Sort recommendations by savings potential
- Implement quick wins — Model switching, prompt optimization (no code changes)
- Set budgets — Allocate per department and set alerts
- Track ROI — Measure cost vs. business impact monthly
- Re-optimize quarterly — As usage patterns change