Tool Recommendations
Advisor Tools provide specialized utilities for AI governance decisions. Use the automated ROI calculator to justify AI investments, readiness checker to identify gaps, risk matrix to prioritize mitigations, and comparison tools to evaluate vendors.
ROI Calculator
TruthVouch automatically calculates return on investment for AI projects in minutes.
How It Works
- Define the project (Customer service chatbot, Content generation, etc.)
- Estimate costs (LLM APIs, infrastructure, team time)
- Estimate benefits (Hours saved, improved efficiency, cost reduction)
- TruthVouch automatically calculates: Payback period, 12-month ROI, 3-year projection
Example: Customer Support AI
Costs:
- LLM API: $2,000/month
- Infrastructure (hosting): $500/month
- Implementation (3 months × 2 FTE): $60,000 (one-time)
- Ongoing team (0.5 FTE): $30,000/year
Total Year 1: $2,500 × 12 + $60,000 + $30,000 = $120,000
Benefits:
- Current support cost: $200,000/year (5 FTE @ $40K)
- AI deflects 40% of tickets (reduce 2 FTE)
- Annual savings: 2 × $40,000 = $80,000
- Improved CSAT (estimated value): $15,000/year
Total Year 1 Benefit: $95,000
ROI Calculation:
- Year 1 net: $95,000 - $120,000 = -$25,000 (loss)
- Year 2+ net: $95,000 - $30,000 = $65,000 (profit)
- Payback: 1.7 months into Year 2
- 3-year ROI: ($65,000 × 2 + $95,000) - $120,000 = $105,000 (87% return)
Interpretation: High-value project; payback within 2 years.
Using the Calculator
- Click Tools → ROI Calculator
- Choose template (Customer Service, Code Generation, Analytics, etc.) or start from scratch
- Fill in:
- Implementation costs (LLM, infrastructure, team time)
- Ongoing costs (API, hosting, FTE)
- Benefits (hours saved, quality improvements, cost avoidance)
- Calculator shows:
- Payback period
- Year 1, 2, 3 projections
- Break-even analysis
- Sensitivity analysis (what if X changes?)
Sensitivity Analysis
Understand impact of assumptions:
“What if API costs increase 50%?”
- New Year 1 cost: $150,000
- Still profitable in Year 2
“What if we only achieve 30% deflection (not 40%)?”
- New annual benefit: $75,000 (vs. $95,000)
- Payback extends to 2.5 years
This helps you understand which assumptions matter most.
Readiness Checker
Assess if your organization is ready for an AI governance initiative.
How It Works
- Answer 15-20 questions about your organization
- Readiness score: 0-100
- Gap analysis by category
- Recommended actions
Readiness Dimensions
Technical Readiness (25%)
- LLM integration capability
- Data infrastructure maturity
- Monitoring and logging capability
- API/SDK integration experience
Governance Readiness (25%)
- Policy and risk framework in place
- Compliance requirements understood
- Cross-functional alignment
- Executive sponsorship
Team Readiness (25%)
- AI expertise on staff
- Training programs available
- Clear role definitions
- Change management capability
Data Readiness (25%)
- Quality and cleanliness of data
- Data governance practices
- Privacy controls in place
- Documentation and lineage
Readiness Levels
| Score | Level | Recommendation |
|---|---|---|
| 80+ | Ready | Proceed with implementation |
| 60-79 | Mostly Ready | Address 2-3 gaps before starting |
| 40-59 | Caution | Significant work needed; consider smaller pilot first |
| <40 | Not Ready | Invest in foundational work (team, data, governance) first |
Example Results
“You scored 72 (Mostly Ready). Gaps to address:”
- Governance (58): “No formal AI governance policy. Recommend drafting policy before large rollout.”
- Data (65): “Data quality varies by source. Recommend data quality assessment and cleanup.”
- Team (72): “Limited AI expertise. Consider hiring or training specialist.”
Actions: All three gaps can be addressed in 2-4 weeks before full implementation.
Risk Matrix
Identify and prioritize AI risks across your organization.
How It Works
- Pre-populated risks — 50+ common AI risks (hallucinations, bias, data privacy, etc.)
- Custom risks — Add organization-specific risks
- Score each risk — Likelihood (1-5) × Impact (1-5) = Risk Score
- Prioritize mitigation — Focus on high-risk items
Risk Categories
Technical Risks
- Hallucinations (incorrect outputs)
- Data quality issues
- Model performance degradation
- System reliability/uptime
- Latency or throughput limits
Compliance Risks
- GDPR/privacy violations
- Data residency violations
- Regulatory non-compliance
- Audit failures
- Certification expirations
Governance Risks
- Unauthorized AI usage (shadow AI)
- Lack of documentation
- Inconsistent policies
- No incident response plan
- Vendor lock-in
Operational Risks
- Team skills gaps
- Vendor dependency
- Cost overruns
- Vendor security breach
- Loss of key personnel
Reputational Risks
- Biased AI (discriminates against groups)
- Brand damage from AI mistakes
- Customer trust erosion
- Regulatory fines
- Media coverage
Risk Scoring
For each risk:
Likelihood (How often might this happen?)
- 1 = Remote (less than 1% chance annually)
- 2 = Low (1-10% annual chance)
- 3 = Moderate (10-50% annual chance)
- 4 = High (50-90% annual chance)
- 5 = Very High (>90% annual chance)
Impact (If it happens, how bad is it?)
- 1 = Negligible (minor inconvenience)
- 2 = Minor (low cost, short delay)
- 3 = Moderate (noticeable impact, weeks to fix)
- 4 = Major (significant cost/delay, regulatory attention)
- 5 = Critical (existential threat, major regulatory/legal action)
Risk Score = Likelihood × Impact (1-25 scale)
Example Matrix
CRITICAL (16-25):├─ Hallucinations in financial advice (5×5=25)├─ GDPR violation from data leak (4×5=20)└─ Regulatory fine for non-compliance (4×4=16)
HIGH (9-15):├─ Biased hiring decisions (3×4=12)├─ Model accuracy drops (4×3=12)└─ Vendor security breach (3×4=12)
MEDIUM (5-8):├─ High API costs (3×2=6)├─ Slow model response (2×3=6)└─ Data quality issues (2×3=6)
LOW (1-4):├─ Minor UX issues (1×3=3)└─ Team training needs (2×2=4)
Mitigation Planning
For each risk:
- Accept — Risk is acceptable (low likelihood/impact)
- Mitigate — Take action to reduce likelihood or impact
- Avoid — Don’t do the activity (eliminates risk but prevents benefit)
- Transfer — Insurance or vendor SLA (vendor liable if they breach)
Example mitigation for “Hallucinations in financial advice”:
- Action: Implement fact-checking against financial database
- Responsible: AI Engineering
- Timeline: 4 weeks
- Cost: $20K
- New Score: Reduced from 25 to 8 (4×2)
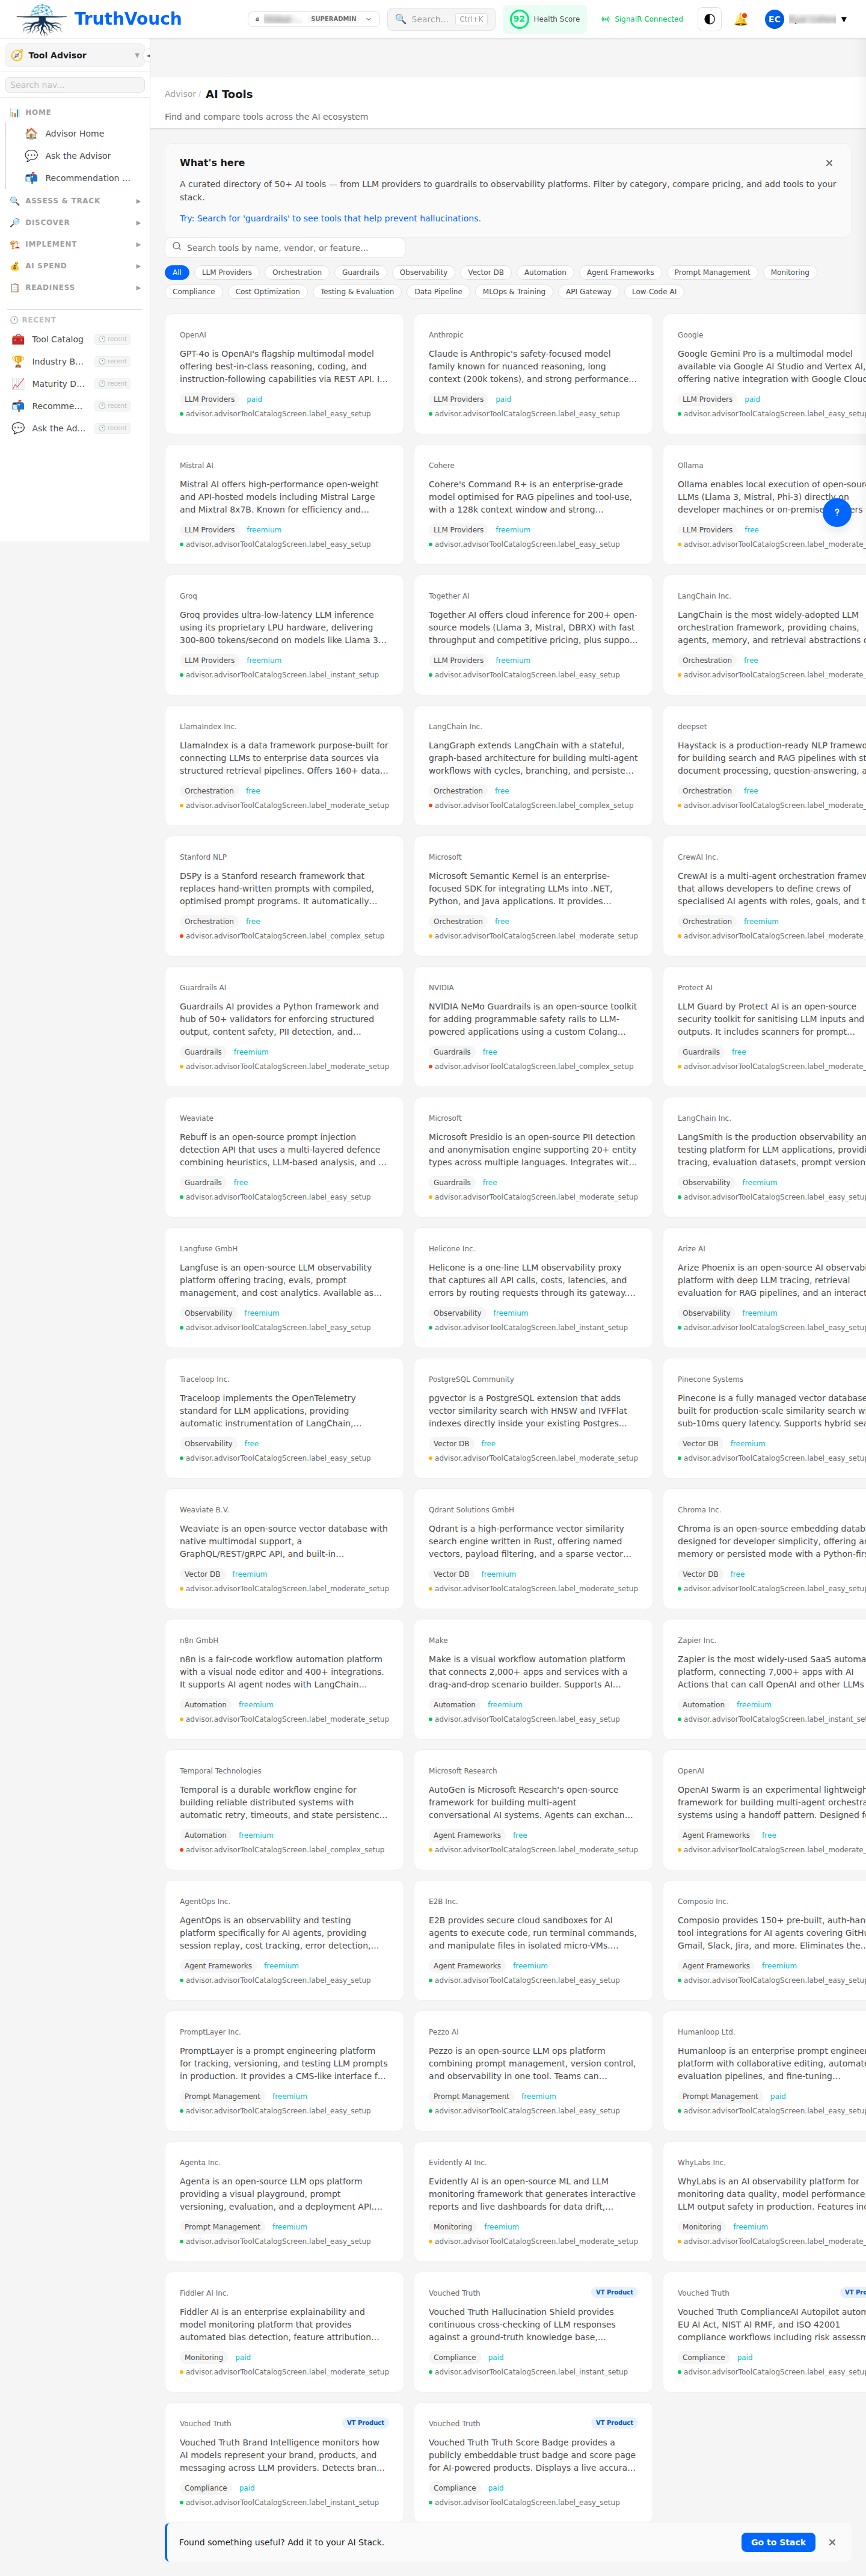
Comparison Tools
Side-by-side comparison of vendors, models, and capabilities.
Vendor Comparison
Compare LLM providers across 20+ dimensions:
| Dimension | OpenAI | Anthropic | Self-Hosted | |
|---|---|---|---|---|
| Cost/1M tokens | $3-$15 | $3-$20 | $0.075-$4 | Infra only |
| Latency (p95) | 2-5s | 2-8s | 1-3s | 100ms-10s |
| Accuracy | Excellent | Excellent | Good | Varies |
| Safety/Alignment | Good | Excellent | Good | Varies |
| Data Privacy | Default to US | Regional options | Regional | On-premise |
| Compliance | SOC 2, ISO | SOC 2, ISO, HIPAA | SOC 2, ISO | Custom |
| API Maturity | Mature | Mature | Growing | N/A |
| Community | Largest | Growing | Large | Large |
Click any vendor to see:
- Full feature matrix
- Customer reviews (if available)
- Case studies in your industry
- Pricing models (per-token, subscription, etc.)
Model Comparison
Compare specific models on performance benchmarks:
| Benchmark | GPT-4 | Claude 3 Opus | Gemini Pro | Llama 2 70B |
|---|---|---|---|---|
| MMLU (knowledge) | 86.4% | 86.5% | 85.9% | 73.5% |
| HumanEval (code) | 88.4% | 84.9% | 74.4% | 48.8% |
| MATH (math) | 52.9% | 58.8% | 32% | 56.7% |
| MGSM (multilingual) | 74.5% | 88.3% | 79% | 37.7% |
| Cost/1M tokens | $15 | $20 | $2.50 | ~$0.10* |
*Self-hosted infrastructure cost
Click any benchmark to see methodology and full results.
Related Topics
- Assessment — Identify your gaps
- Blueprints — Pre-built implementation plans
- Vendor Evaluation — Detailed vendor comparison
Next Steps
- Run ROI calculator on your planned AI project
- Take readiness checker to identify gaps
- Create risk matrix and prioritize mitigations
- Compare vendors/models using comparison tools
- Share findings with leadership and cross-functional team