Page-Level GEO Audit
While site-level audits give you an overall picture, page-level audits drill into individual pages to show exactly what needs to be fixed on each page.
Running a Page-Level Audit
From Site Audit Results
After running a site audit, click any page in the “Per-Page Results” table to see detailed analysis of that page.
Direct Page Audit
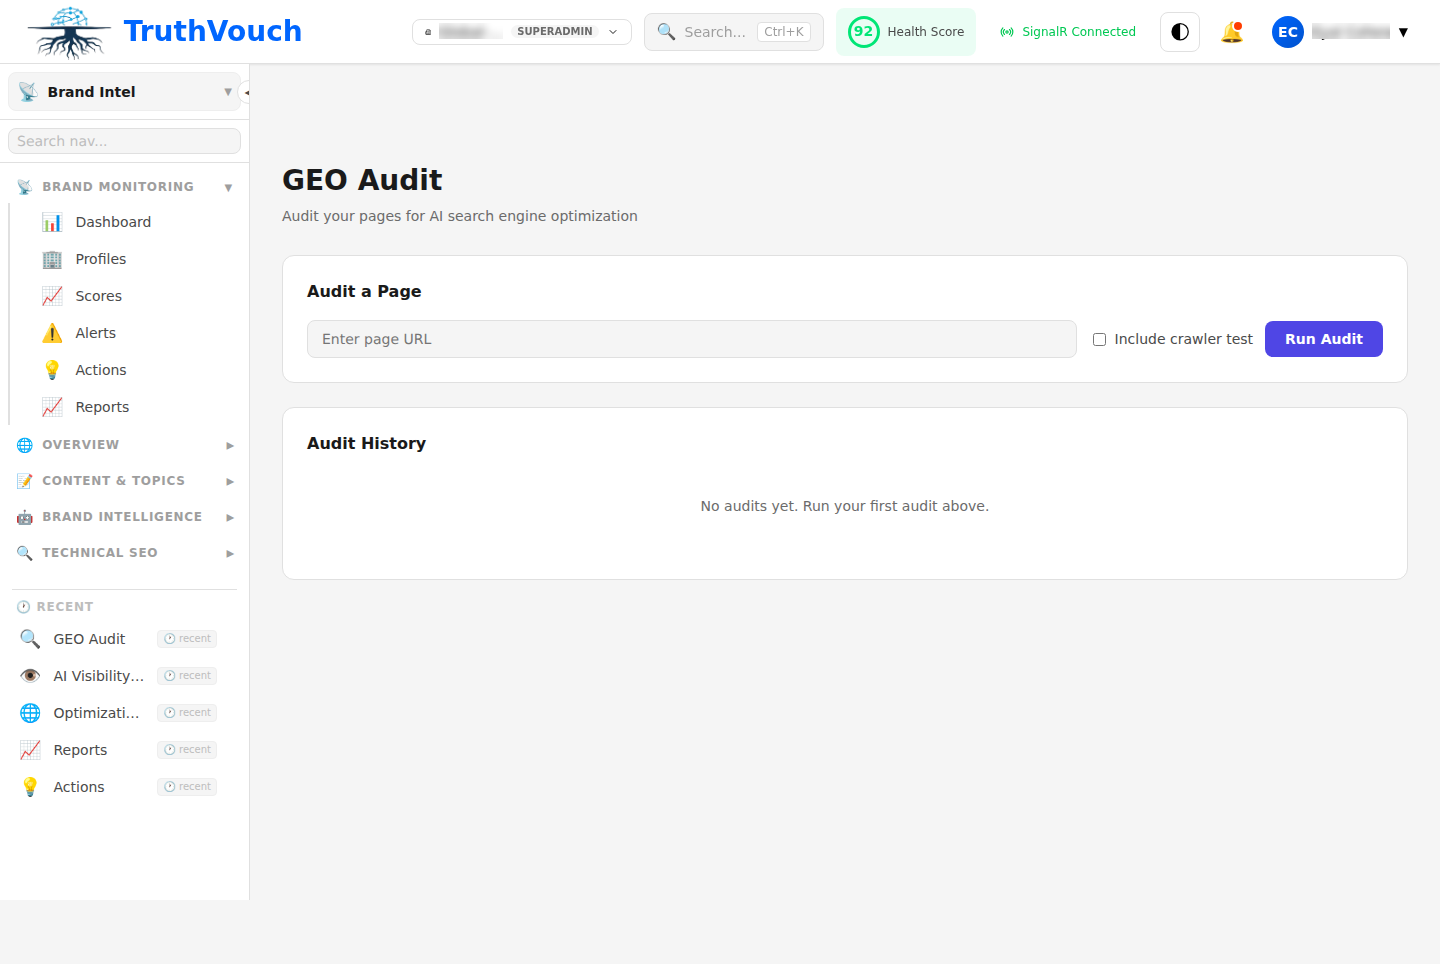
Navigate to Brand Intelligence → GEO → Page Audit and enter:
- Page URL: Full URL of the page to audit (e.g.,
https://example.com/products/ai-governance) - Page Type: Product, Blog, Pricing, Home, About, or Other
- Dimensions: Select which dimensions to audit (default: all 12)
Click Analyze. TruthVouch automatically generates detailed recommendations for that page.
Page-Level Analysis
Overall Page Score (0-100)
This page’s average score across selected dimensions.
What affects the score:
- Content quality (40% of score)
- Structure and readability (35%)
- Optimization elements (25%)
Dimension Breakdown
Each dimension shows:
- Score (0-100)
- Analysis (what’s working, what needs work)
- Specific issues (bullet list of problems found)
- Recommended fixes (with effort estimates)
Example Page-Level Analysis
Page: /products/ai-governance
Overall Score: 68/100
Factual Density: 55/100
Analysis: “This page mentions features but lacks specific facts, numbers, or evidence.”
Issues:
- “Designed for enterprises” (vague) — no customer count or case study
- “Sub-200ms latency” stated but no supporting evidence
- “99.9% uptime SLA” mentioned but not explained
Fixes:
- Add customer case study with customer count (+2 points)
- Add benchmark or test results for latency claim (+1 point)
- Link to SLA documentation (+1 point)
Answer Blocks: 72/100
Analysis: “Good TL;DR exists, but the page could better answer related questions.”
Issues:
- Page doesn’t answer “How is it different from competitors?”
- No FAQ section
- “Getting started” not immediately obvious
Fixes:
- Add comparison table (vs. competitors) (+3 points)
- Add FAQ section to bottom (+3 points)
- Add “Getting started” button above fold (+1 point)
Structured Data: 40/100
Analysis: “Product page lacks proper schema markup.”
Issues:
- No Product schema (schema.org)
- No pricing information marked as PriceSpecification
- No aggregate rating schema
Fixes:
- Add Product JSON-LD schema (+15 points) — High impact, 15 min effort
- Add pricing schema (+5 points) — 5 min effort
- Optionally add FAQ schema if FAQ section added (+5 points)
Content Freshness: 88/100
Analysis: “Page is current. Last updated 3 months ago, which is good.”
Issues:
- None; this dimension is strong
Comparing Pages
Navigate to Brand Intelligence → GEO → Page Comparison to see:
| Page | Score | Factual | Blocks | Citation | Freshness | … |
|---|---|---|---|---|---|---|
| Homepage | 78 | 85 | 72 | 88 | 92 | … |
| /products | 65 | 55 | 45 | 70 | 88 | … |
| /pricing | 72 | 80 | 60 | 75 | 45 | … |
Insights:
- Weakest page:
/products(65/100) — Product pages are your biggest opportunity - Strongest page:
Homepage(78/100) — Model for other pages - Consistent weakness: “Answer Blocks” across all pages — opportunity to add FAQs
Prioritizing Page Improvements
1. Identify Lowest-Scoring Pages
These need the most work.
Example priority list:
- /products (65/100) ← Start here
- /pricing (72/100)
- /about (75/100)
- /blog/launch-2024 (76/100)
2. For Each Page, Identify Highest-Impact Fixes
Use this formula:
Priority = Impact / EffortExample for /products page:
- Add structured data: +15 points, 15 min = Priority 1 (High)
- Add comparison table: +3 points, 1 hour = Priority 2 (Medium)
- Rewrite for factual density: +8 points, 3 hours = Priority 3 (Medium)
- Add FAQ section: +3 points, 2 hours = Priority 4 (Medium)
3. Implement in Order
Week 1: All Priority 1 items (high-impact, quick-fix) Week 2: Priority 2 items (medium-impact, short effort) Week 3-4: Priority 3-4 items (longer-effort items)
Common Page Issues & Fixes
Product Pages Score Too Low
Why: Product pages often lack:
- Comparison to alternatives
- Customer examples or case studies
- FAQ sections
- Pricing or tier information
Fixes (in order of impact):
- Add Product schema markup with pricing (+10-15 points)
- Add FAQ section (+5 points)
- Add comparison table (+3 points)
- Add customer case study (+3 points)
Blog Pages Score Low
Why: Blog posts often lack:
- Recent publication date
- Author attribution
- Related links to other content
- Structured data
Fixes (in order of impact):
- Add publication date and “Last updated” (+5 points)
- Add author info and credentials (+2 points)
- Add internal links to related blog posts (+3 points)
- Add Article schema markup (+5 points)
Homepage Score Too Low
Why: Homepages are often vague:
- “We’re the leader in X” without supporting facts
- Too much marketing speak, not enough facts
- No clear answer to “What does this company do?”
Fixes (in order of impact):
- Add specific facts in first paragraph: “Founded 2020, 500+ customers, ISO 27001 certified” (+10 points)
- Add clear company structure with Organization schema (+5 points)
- Add internal links to key pages (+3 points)
- Update last-modified date (+2 points)
Page-by-Page Recommendations Display
Recommendations are grouped by effort:
Quick Wins (15-30 minutes)
- Add/update publication date
- Add internal links (link to 3-5 related pages)
- Add alt text to images
- Update metadata
Short Effort (1-2 hours)
- Add structured data/JSON-LD
- Create FAQ section
- Improve heading hierarchy
- Rewrite opening paragraph for clarity
Medium Effort (2-4 hours)
- Rewrite page for factual density
- Add comparison table
- Develop customer case study
- Restructure page sections
Long Effort (4+ hours)
- Comprehensive page redesign
- Create new content sections
- Conduct market research for accuracy
- Develop original research/data
Content Freshness at Page Level
Each page shows:
- Current status: Last updated date, how long ago
- Freshness score: 0-100 based on age
- Updated in last 30 days: 95-100
- Updated 30-90 days ago: 75-95
- Updated 90-180 days ago: 50-75
- Updated 180+ days ago: Below 50
- No date specified: Cannot score
Action: Pages scoring below 75 should be reviewed for accuracy.
Exporting Page Results
From any page analysis, click Export → PDF to get:
- Page analysis summary
- Dimension scores
- Specific recommendations
- Implementation checklist
Useful for sharing with your content team.
Page Performance Trends
If you re-audit the same page over time:
Page: /productsAudit 1 (Jan 15): 65/100Audit 2 (Feb 1): 71/100 (+6 after implementing quick wins)Audit 3 (Mar 1): 78/100 (+7 after structured data + FAQ)This shows progress and helps you track which fixes had the most impact.
Next Steps
- Site-Level Audits → — Understand overall website health
- Understanding Recommendations → — Deep dive into action items
- Auto-Fix Capability → — Implement structured data automatically
- GEO Scoring Formula → — Understand the math behind scores