Evidence Connectors
TruthVouch automatically connects to your infrastructure to collect evidence proving controls are working. You configure each connector once, then Compliance AI pulls live data during scans — no manual evidence gathering required.
Supported Connectors
Cloud Infrastructure
- AWS: CloudTrail logs, IAM policies, KMS encryption, VPC security
- Azure: Activity logs, managed identity, encryption, security controls
- Google Cloud: Cloud Audit Logs, IAM bindings, encryption
- Kubernetes: RBAC policies, network policies, resource logs
Development & Code
- GitHub: Code commits, secret scanning, branch protection, security advisories
- GitLab: CI/CD logs, code quality, security scanning
- Azure DevOps: Build logs, release pipelines, test results
Identity & Access
- Okta: User access reviews, MFA enforcement, audit logs
- Azure AD: Sign-in logs, access reviews, device compliance
- 1Password: Vault access logs, team members
- HashiCorp Vault: Access logs, secret rotation
Monitoring & Observability
- Datadog: Performance metrics, alerting, logs, infrastructure monitoring
- Prometheus: Metrics, scrape configs, alerting rules
- CloudWatch: Metrics, logs, alarms
- Dynatrace: Performance monitoring, security controls
Communication & Collaboration
- Slack: Channel activity (for training evidence), announcements
- Microsoft Teams: Chat, training announcements
IT Service Management
- ServiceNow: Change management, incident tickets, CMDB
- Jira: Issue tracking, incident response, remediation tasks
How to Configure Connectors
- Go to Settings > Integrations
- Select connector
- Authenticate (OAuth2 or API key)
- Grant minimal required permissions
- Test connection
- Click Enable
Compliance AI securely stores credentials and rotates API keys automatically.
What Each Connector Provides
| Connector | Evidence Type | Examples |
|---|---|---|
| AWS | Infrastructure logs, IAM policy, encryption status | ”S3 bucket encrypted with KMS” |
| GitHub | Code history, secret scanning | ”Commit log showing code review” |
| Okta | Access control, MFA | ”All users have MFA enabled” |
| Datadog | Performance monitoring, alerting | ”Model accuracy dashboard showing 92% accuracy” |
| ServiceNow | Change management, incidents | ”Change ticket #CHG-12345 approved and deployed” |
Best Practices
- Minimal permissions: Grant only what’s needed (read-only when possible)
- Secure credentials: Use OAuth2 or service accounts, never personal tokens
- Monitor access: Review audit logs of connector access
- Rotation: Periodically rotate API keys (at least annually)
- Test connectivity: Verify monthly
Setup by Connector
AWS
- Go to Settings → Integrations → AWS
- Click Connect AWS Account
- Choose auth method:
- IAM Role (recommended): Use CloudFormation template
- Access Keys: Enter AWS_ACCESS_KEY_ID and AWS_SECRET_ACCESS_KEY
- Grant permissions: Read-only access to CloudTrail, CloudWatch, IAM, KMS
- Test connection
- Click Enable
What’s Collected:
- CloudTrail logs (all API calls)
- IAM policies and MFA status
- KMS encryption keys
- VPC security group rules
- S3 bucket encryption
GitHub
- Settings → Integrations → GitHub
- Click Authorize GitHub
- Grant permissions to repositories
- Select which repos to monitor
- Click Enable
What’s Collected:
- Commit history and code reviews
- Branch protection rules
- Secret scanning alerts
- Dependabot vulnerability alerts
- Release history
Okta
- Settings → Integrations → Okta
- Enter Okta domain:
yourcompany.okta.com - Generate API token in Okta admin
- Paste API token
- Click Test & Enable
What’s Collected:
- User directory and group memberships
- MFA enrollment status
- App assignments and access
- Sign-in logs
- Policy rules
ServiceNow
- Settings → Integrations → ServiceNow
- Enter instance URL:
yourcompany.service-now.com - Create service account in ServiceNow
- Enter username/password or OAuth credentials
- Grant permissions: Read/write on Change, Incident, CMDB tables
- Click Enable
What’s Collected:
- Change management approvals
- Incident tickets and resolution
- Configuration items
- Deployment records
- Maintenance windows
Datadog
- Settings → Integrations → Datadog
- Generate API key in Datadog
- Enter API key and App key
- Specify which dashboards/monitors to pull
- Click Enable
What’s Collected:
- Dashboard metrics and visualizations
- Monitor alert status
- Log data
- Performance metrics
- Security event logs
Azure
- Settings → Integrations → Azure
- Click Authorize Azure
- Sign in with Azure account
- Select subscription
- Grant permissions to read Activity Logs, identity, encryption
- Click Enable
What’s Collected:
- Activity logs
- Managed identity configurations
- Encryption status
- Access reviews
- Device compliance
Evidence Collection Frequency
- Real-Time: Auth/access events (Okta, Azure AD)
- Hourly: Infrastructure metrics (AWS, Azure)
- Daily: Code commits, incident tickets
- Weekly: Summary reports, compliance scans
You can force manual refresh:
- Settings → Integrations → [Connector]
- Click Refresh Now
Troubleshooting Connectors
Connection Failed
- Verify credentials are still valid
- Check API key hasn’t been rotated
- Verify permissions still granted
- Try Refresh Now button
- Check Recent Activity log for error details
No Data Collected
- Verify connector is Enabled (toggle on)
- Check if permissions include needed resources
- Ensure systems have actual data to collect
- Try Refresh Now
- Wait 30 minutes for initial collection
Too Many Permissions Requested
We request minimum needed for evidence collection:
- Read-only access when possible
- No write/delete permissions
- Scoped to specific resources
This is intentional for security.
Next Steps
- Configure your first connector: Go to Settings > Integrations
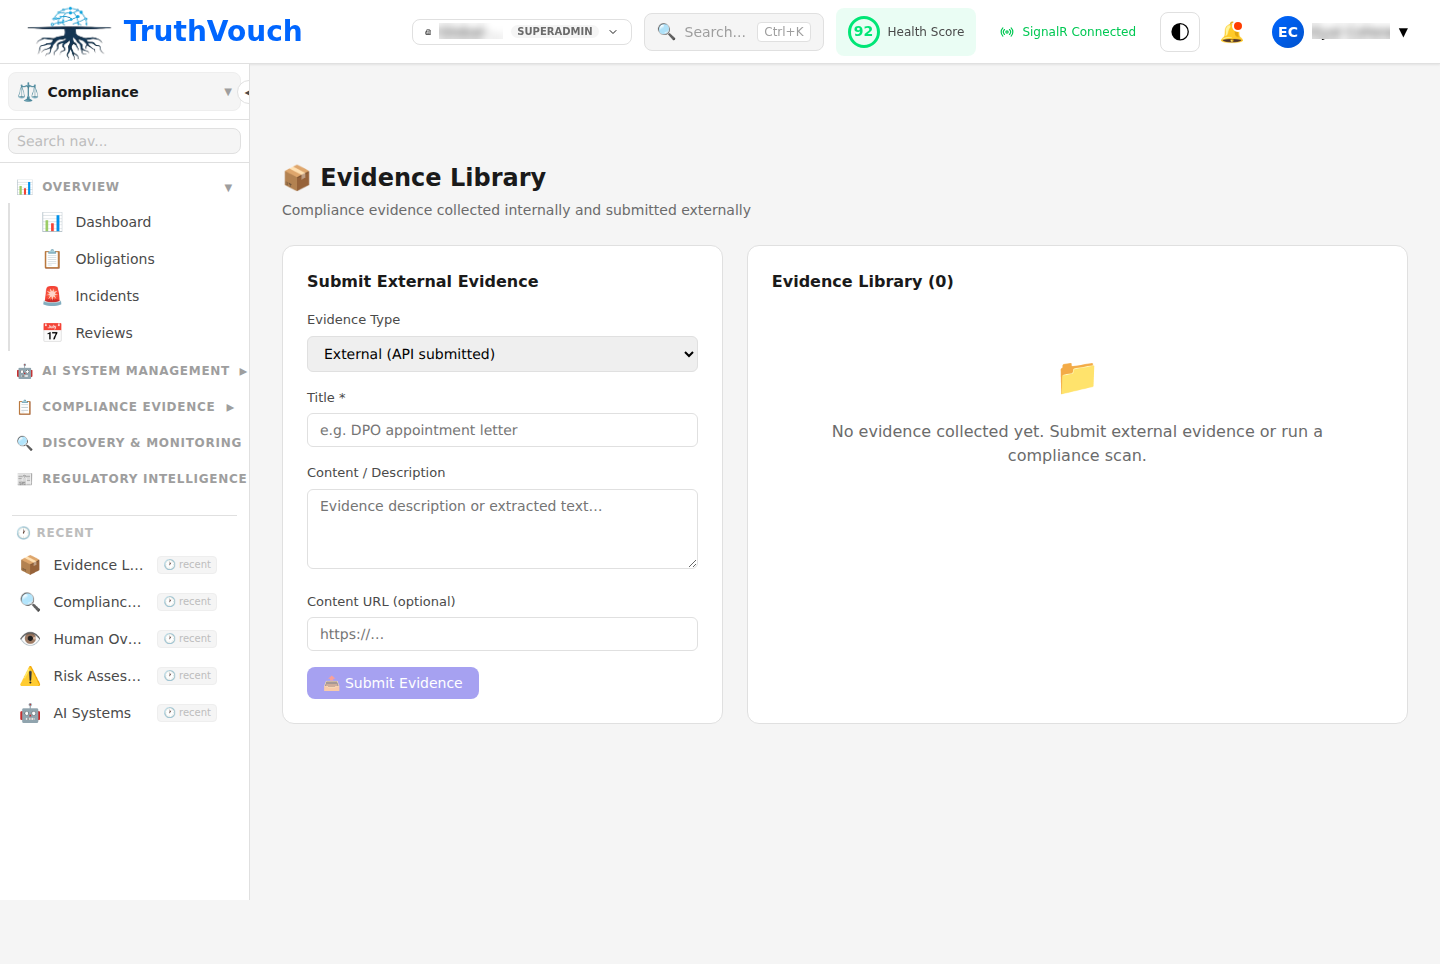
- Manual evidence upload: Manual Evidence for systems not yet integrated
- Review evidence: Evidence Review