Dashboard & Health Score
The Shield dashboard is your command center for hallucination detection. It shows at a glance what AI engines are saying about you and where inaccuracies exist.
Health Score
The Health Score is a 0-100 aggregate measure of AI accuracy about your organization.
What It Measures
Health Score = weighted average of all cross-checks against your Truth Nuggets across all monitored AI engines.
Calculation:
- Each cross-check gets a 0-100 truth score (how well AI response matches your truth)
- Scores are weighted by fact importance (Financial facts weighted higher than other categories)
- Average across all engines and facts = your Health Score
Examples:
- 95+ = Excellent. AI engines are highly accurate about you.
- 85-94 = Good. Minor discrepancies; your main narrative is correct.
- 70-84 = Fair. Some hallucinations; brand risk emerging.
- 60-69 = Poor. Significant inaccuracies; urgent action needed.
- <60 = Critical. Major hallucinations; deploy corrections immediately.
Trend Tracking
Health Score trends over time:
- Green arrow (↑): Score improving. Corrections are working.
- Gray line (→): Score stable. Hallucinations are consistent.
- Red arrow (↓): Score declining. New hallucinations emerging; investigate.
Example: “Health Score was 82 on March 1, now 87 on March 14 (↑ 5 points). Corrections deployed 2 weeks ago are taking effect.”
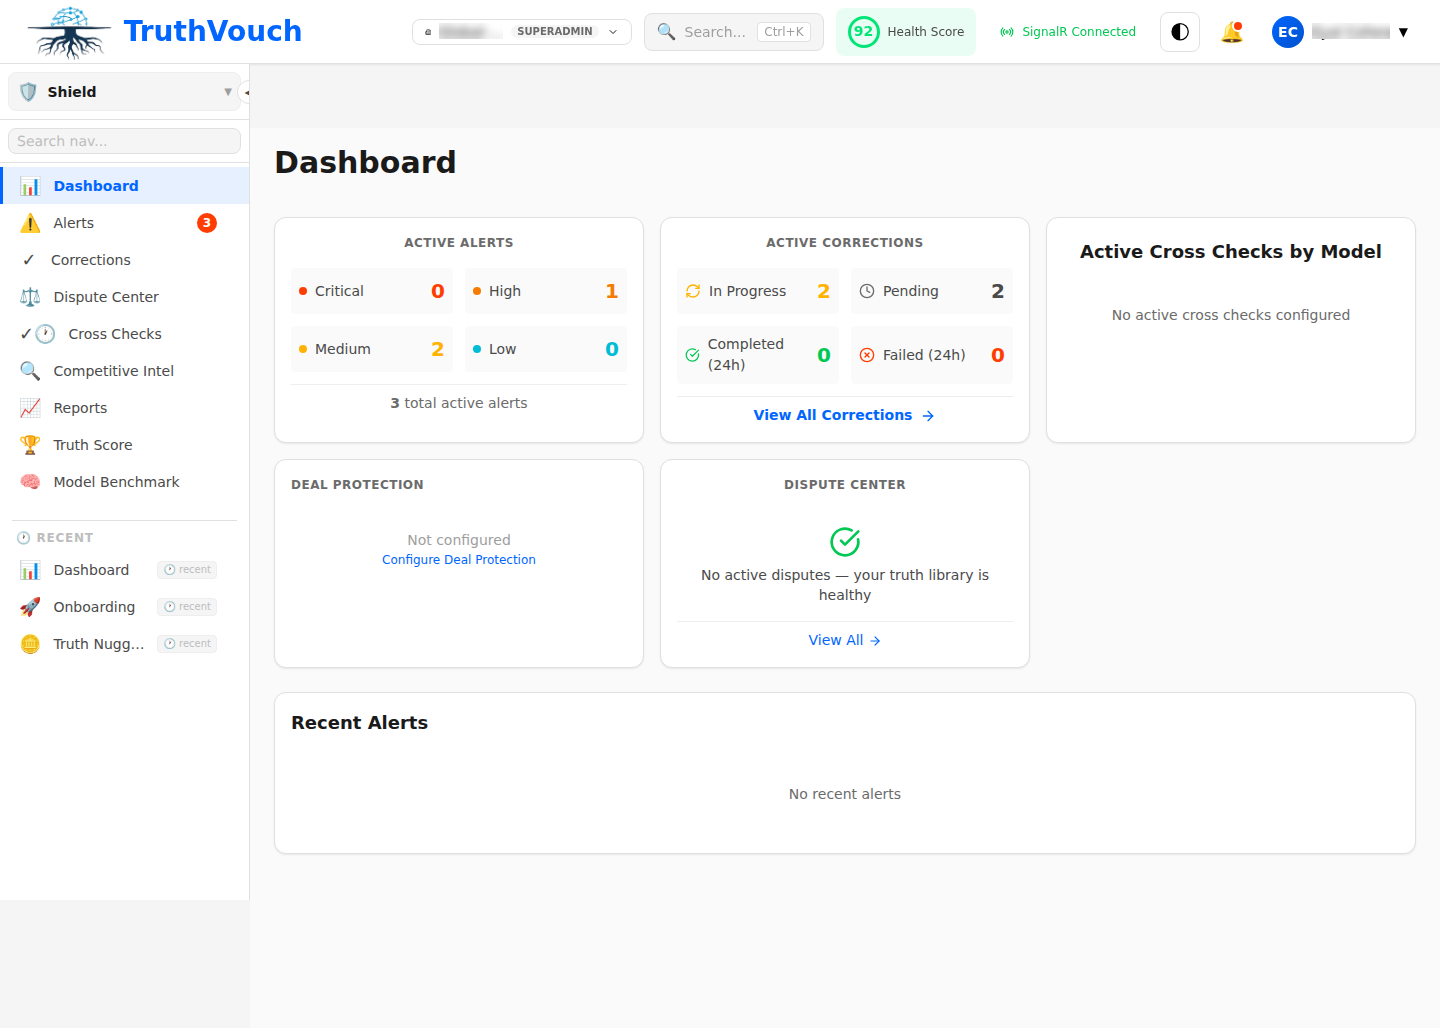
Dashboard Widgets
1. Health Score Card (Top Left)
- Large, prominent display
- Current score (0-100)
- Trend arrow + points gained/lost since last week
- Click to see score history (last 30 days)
2. Recent Alerts (Top Center/Right)
- Last 5-10 alerts
- Each shows: severity, AI engine, fact name, time
- Color coded: Red (critical), Orange (high), Yellow (medium), Gray (low)
- Click any alert to review full details
3. Top Issues (Center Left)
- Hallucinations cited most frequently across all AI engines
- Ranked by impact (critical → low)
- Shows: issue name, count, affected engines
- Example: “Product pricing incorrect (8 citations, ChatGPT/Claude/Perplexity)“
4. Engine Comparison (Center Right)
- How accurate each monitored engine is about you
- Health score for ChatGPT, Claude, Gemini, etc., side-by-side
- Identify which engines are most problematic
- Example: ChatGPT (88), Claude (92), Gemini (76), Perplexity (85)
5. Correction Status (Bottom Left)
- How many corrections are pending, deployed, verified
- Breakdown: “8 deployed, 5 verified, 2 in progress”
- Timeline: average time from detection to correction
- Example: “Average correction time: 14 hours”
6. Trends & History (Bottom Right)
- Health Score trend line (30-day view)
- Annotation markers for major events:
- “Correction deployed” (point on line)
- “New product launched” (new fact added)
- “Truth Nugget updated” (baseline shift)
Filtering & Views
Filter by Category
Click category tabs to see scores only for specific Truth Nugget categories:
- Company
- Products
- Leadership
- Financial
- Technical
- Legal
- Competitive
Example: “Zoom into Product facts to see Health Score just for your product information (89).”
Filter by Engine
Click engine badges to focus on specific AI engines:
- Just ChatGPT: 91
- Just Claude: 93
- Just Gemini: 82
See which engines are your weakest performers.
Filter by Severity
- Critical (>80)
- High (60-80)
- Medium (40-60)
- Low (<40)
- Resolved
Focus on issues that matter most.
Time Range
- Last 24 hours
- Last 7 days
- Last 30 days
- Custom range
See how things have evolved over time.
Detailed Views
Alert Details
Click any alert to see:
- Full AI Response: Exact text the engine generated
- Your Truth: What you said vs what AI said (side-by-side)
- Entity Extraction: Which specific entities (dates, names, numbers) conflict
- Confidence: How confident NLI is about the mismatch (85%+)
- Suggested Correction: Auto-generated fix
- Source: URL or document being referenced
Engine Deep Dive
Click any engine in the comparison to see:
- Overall accuracy score for that engine
- Category breakdown (which categories is it accurate/inaccurate on)
- All alerts specific to that engine
- Correction history (which corrections improved accuracy for this engine)
Example: “Gemini: Overall 82. Accurate on Products (92), poor on Financial (71).”
Trend Analysis
Click the trend chart to see:
- 90-day Health Score history (line chart)
- Annotation overlay: when corrections deployed, facts added
- Correlation: “Health Score improved 8 points after deploying corrections to products category”
- Seasonality: “Every Monday AI responses are 3 points lower (fresh training data?)”
Actions from Dashboard
Approve Corrections
When Shield suggests a correction:
- Click the alert
- Review suggested correction
- Click Approve Correction
- Choose method: Neural Fact Sheet (default) or Direct Feedback
- System confirms: “Deploying correction…”
Correction deploys within seconds; verification happens 24-72 hours later.
Edit Truth Nuggets
When you spot a false positive (your nugget is wrong):
- Click the alert
- Review your Truth Nugget text
- Click Edit Nugget
- Update the fact text, confidence, or source
- Save
- Shield re-scores immediately; alert may resolve
Dismiss Alerts
For false positives you don’t want to fix (AI interpretation is valid even if not exactly matching your truth):
- Click the alert
- Click Dismiss
- Choose reason: “Paraphrase OK”, “Outdated nugget”, “Marketing hyperbole”
- System learns from dismissals
Schedule Follow-Up
For complex issues needing team discussion:
- Click the alert
- Click Assign to Team Member
- Choose team member and due date
- They get notified
Mobile View
On mobile (or narrow desktop), the dashboard adapts:
- Health Score stays prominent at top
- Other widgets stack vertically
- Filters move to collapsible menu
- Swipe between tabs for different views
Full functionality preserved — you can manage alerts from your phone.
Customization
Reorder Widgets
Drag and drop widgets to arrange dashboard your way:
- Hover over widget header
- Drag to new position
- Saved automatically
Hide/Show Widgets
Click the eye icon on any widget to hide it:
- Hide low-relevance widgets
- Focus on what matters to you
- Your settings saved per account
Set Refresh Rate
Auto-refresh every: 1 min, 5 min, 15 min, 1 hour, never
- Real-time monitoring: 1 min (updates every 60 sec)
- Standard: 15 min
- Low-priority: 1 hour
Save Custom Views
Save filtered dashboards for different purposes:
- “CEO Morning Check” (Health Score + Top Issues only)
- “Marketing Deep Dive” (Products category, top issues, engine comparison)
- “Compliance Review” (Legal + Financial, last 90 days)
Click Save as View, give it a name, share URL with team.
Exporting Data
Export Dashboard Snapshot
Click Export → PDF:
- Clean, printable dashboard view
- Timestamp and data accuracy note
- Share with executives or auditors
Export Raw Data
Click Export → CSV to get:
- All alerts (raw data)
- All cross-checks (queries, responses, scores)
- Correction history (all deployed fixes)
For analysis in Excel, Tableau, or other tools.
Real-Time Monitoring (Professional+)
Enterprise teams can:
- Pin dashboard to TV screen for real-time monitoring
- Set up Slack notifications for new alerts
- Stream Health Score via API to custom dashboards
Setup in Settings → Integrations.
Performance Tips
For Slow Networks
- Increase refresh rate (1 hour instead of 1 min)
- Hide trend chart (computationally heavy)
- Filter to 1-2 engines instead of all
For Large Knowledge Bases (100+ Nuggets)
- Filter by category (don’t view all at once)
- Focus on top issues (sort by impact)
- Use time range filters (last 7 days vs 90 days)
Next Steps
- Understanding Alerts — How to respond to detections
- Cross-Check Scheduling — Fine-tune monitoring
- Correction Details — How corrections deploy